 Acad
AcadWhat Is a Locator Map? A Practical Guide for Research Figures
What is a locator map? It is a small inset map that shows readers where your study area sits within a larger geographic context, so that a figure of a single watershed, city, or field site does not leave anyone wondering which part of the world they are looking at. Locator maps are a quiet staple of published research figures, and getting one right takes less effort than most people assume once you know the pattern.
What is a locator map (and how it relates to an inset map)?
A locator map is a small, simplified map placed alongside or inside a larger figure to show where the main map is located. It answers a single question: where in the world is this? Typically it highlights your study region against a broad backdrop, such as its country or continent, and often uses a box or connector lines to tie the wide view to the zoomed-in view.
The phrase inset map is closely related and frequently used as a synonym. Strictly speaking, an inset is any smaller map nested inside a larger one. A locator map is the most common purpose for an inset: giving location context. The other common inset does the opposite, zooming in on a crowded detail area (for example, a dense downtown) that would be illegible at the main scale. So every locator map is an inset map, but not every inset map is a locator map.
Honest tools note: you do not need anything exotic to build one. GeoPandas plus Matplotlib can produce a locator with a second set of axes, QGIS has a dedicated overview panel and print-layout insets, and folium can embed a mini-map for web maps. AcadGIS, covered below, mainly removes the repetitive wiring for the academic case.
When should you use a locator map?
Add a locator map whenever a reader cannot instantly place your study area from the main map alone. In practice that covers most local and regional research figures. Concrete triggers:
- Local or sub-national sites: a single catchment, forest plot, transect, or municipality means little without a country-level anchor.
- International readership: journal audiences are global; a district obvious to a domestic reader is unfamiliar to everyone else.
- Unfamiliar or renamed places: administrative names change and are easily confused, so a visual anchor beats a place name.
- Multi-site studies: a locator shows how scattered sites relate to one national or regional frame.
You can usually skip a locator when the main extent is already a universally recognizable whole country or continent, or when the surrounding text makes location unambiguous. When in doubt, include it: a small inset costs little space and removes a real comprehension barrier.
Locator map vs study-area map vs overview map
These three terms get muddled because a single figure often contains all three. They differ by purpose and scale. The locator zooms out to orient; the study-area map is the main analytical panel; the overview map summarizes the whole region at intermediate scale. Keeping them distinct helps you decide what each panel should actually show.
| Map type | Primary purpose | Typical scale | What it shows |
|---|---|---|---|
| Locator (inset) map | Orient the reader; answer "where is this?" | Small scale (country, continent, or world) | Study area highlighted as a dot or box within a broad frame, minimal detail |
| Study-area map | Present the actual analysis or data | Large scale (site, city, watershed) | Sample points, boundaries, terrain, choropleths, the substantive content |
| Overview map | Summarize the wider region and its features | Intermediate scale (province, basin, metro region) | Roads, rivers, settlements, and how sites relate across the region |
How to make a locator map in Python: the manual pattern
Every locator map, regardless of tool, follows the same recipe: load a broad boundary, load your study area, plot the study area small inside the context, and highlight it. The reusable idea is a cascade from wide context down to the specific site. Below, AcadGIS loads bundled boundaries and highlights the target region in one call, which is the core building block you would otherwise assemble by hand in GeoPandas.
import acadgis as agis

# Load India's states and highlight one region for a locator panel
states = agis.load_boundaries("India", level="state")
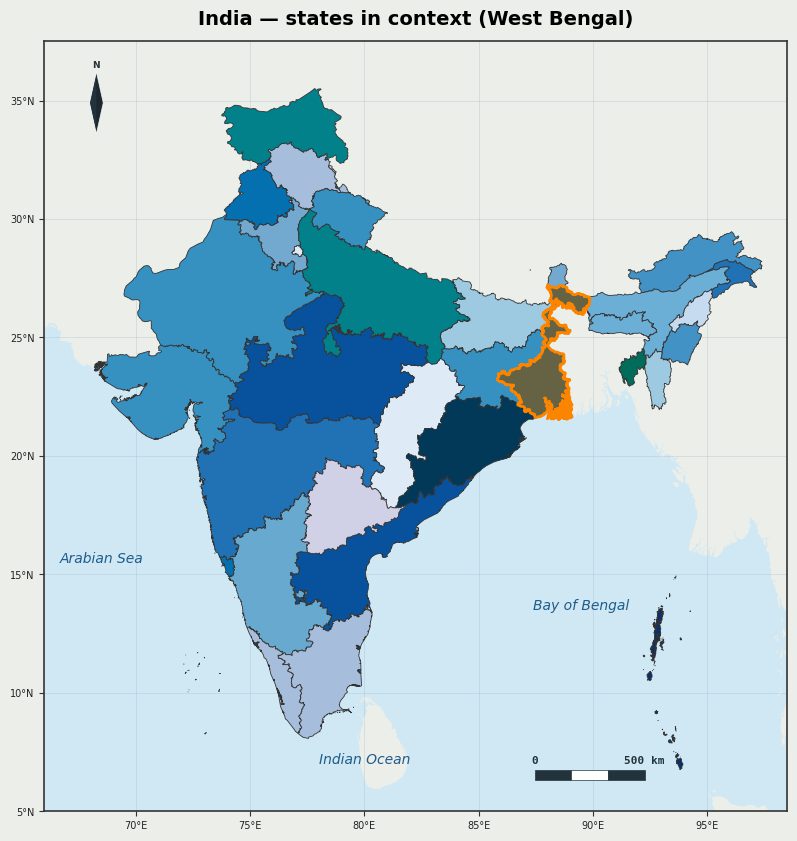
agis.plot(states, highlight="Uttarakhand", theme="academic",
          title="Study region within India",
          north_arrow=True, scale_bar=True)
agis.save("locator.png", dpi=300)
Building the country-to-region-to-site cascade with StudyArea
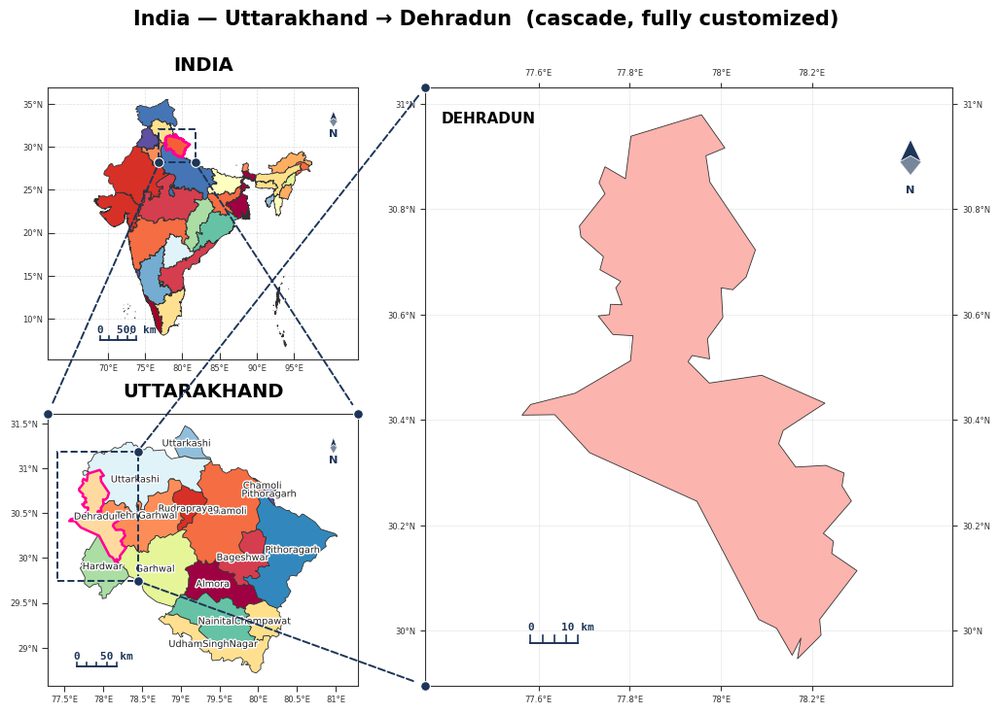
The most useful locator for research is not a single inset but a cascade: country, then region, then site, with connector lines drawn between panels so the eye follows the zoom. AcadGIS builds this directly. The StudyArea class reads as a sentence, from national context down into a district-level detail panel, and returns a finished figure you can save at print resolution.
import acadgis as agis

# Country -> region -> site cascade with connectors between panels
fig = (agis.StudyArea("India", context_level="state")
           .zoom_into("Uttarakhand", detail_level="district")
           .figure(suptitle="Study area: Dehradun, Uttarakhand, India"))
agis.save("study_area_cascade.png", dpi=300)
A one-call cascade with study_area()
If you prefer a flat, explicit list of steps, the functional study_area() helper produces the same connected cascade from a sequence of levels. This form is handy for scripting many sites or for the USA and other bundled countries. You can toggle terrain, rivers, and labels as the figure needs.
For a point-and-click alternative, the AcadGIS locator map generator builds the same cascade from menu selections, the study-area map generator assembles the full multi-panel figure, and the world map country highlighter is ideal when your broadest frame is the whole globe.
import acadgis as agis

# Same idea, expressed as an explicit list of zoom steps
fig = agis.study_area(
    "USA",
    steps=[("state", "California"), ("county", "Los Angeles")],
    template="cascade", rivers=True, labels=True)
agis.save("us_cascade.png", dpi=300)
Getting the data and finishing touches
The quality of a locator map lives in its boundaries. Reliable open sources are GADM and Natural Earth for administrative units, OpenStreetMap for fine local detail, and Copernicus GLO-30 if you want a terrain backdrop. Classification for any accompanying choropleth is typically handled by mapclassify. AcadGIS bundles India, the USA, Bangladesh, and Iraq offline and fetches other countries by name, so you rarely wrangle shapefiles by hand.
A few finishing details separate a rough draft from a publication figure. Keep the locator small and low-detail so it never competes with the main panel. Highlight the study area with a single saturated color against muted context, so the eye lands on it immediately. Include a north arrow and scale bar on the main map, not the inset, where they would only add clutter. Keep connector lines thin and unobtrusive, and match the projection of the inset to the main map so shapes do not appear to disagree. Whether you assemble it in GeoPandas, lay it out in QGIS, or generate it with AcadGIS, a good locator map is quiet, correct, and instantly answers the reader's first question: where is this?
Frequently asked questions
What is a locator map?
A locator map is a small inset map that shows where a study area sits within a larger geographic frame, such as a country, continent, or the world. It orients readers who may not recognize the main map's location, usually by highlighting the region and drawing connectors from the broad context down to the specific site.
What is the difference between a locator map and an inset map?
The terms are often used interchangeably, but "inset map" describes any smaller map nested inside a larger figure, while "locator map" describes its most common job: showing location context. A locator map is a type of inset map; other insets might instead zoom in on a dense detail area rather than zoom out for context.
When should I add a locator map to a figure?
Add a locator map whenever readers cannot instantly place your study area from the main map alone. This is essential for local or regional sites, international audiences, and journals with global readership; it is less necessary when the extent is already a universally recognizable country or continent.
How do I make a locator map in Python?
You can build one with GeoPandas and Matplotlib by plotting a context boundary, overlaying your study area, and adding an inset axis, or you can use AcadGIS to generate the cascade automatically with study_area() or the StudyArea class. AcadGIS handles the country-to-region-to-site figure, connectors, and academic styling in a few lines.
Can I make a locator map without coding?
Yes. QGIS supports locator maps through its overview panel and print layout insets, and web tools like the AcadGIS locator map generator produce a cascade from menu selections. Coding with GeoPandas or AcadGIS is preferable when you need reproducibility, version control, or batch generation across many sites.
Where does the boundary data come from?
Common open sources are GADM and Natural Earth for administrative boundaries and OpenStreetMap for finer detail. AcadGIS bundles boundaries for Bangladesh, Iraq, India, and the USA offline and downloads other countries by name, so you rarely assemble shapefiles by hand.