 Acad
AcadLocator Map Generator: Nest Your Site in Its Region and Country
A locator map generator turns a single study site into a clear "where on Earth is this?" figure by nesting the site inside its region inside its country. AcadGIS builds that cascade as a multi-panel inset figure, with connecting arrows, from a couple of lines of Python.
What is a locator map and why researchers need one
A locator map (also called a key map or inset map) answers the first question every reviewer asks about a figure: where is this? It places your study site in geographic context by nesting it inside progressively larger areas — a district inside a state inside a country — so a reader who has never heard of your field site can orient themselves in seconds.
For a paper, thesis or grant, this context is not optional. A close-up of your sampling grid, watershed or plot is meaningless without a panel showing the country and region it sits in. A good locator map generator produces this cascade automatically instead of forcing you to hand-align insets in Illustrator or QGIS. If you also need a full detail map of the site itself, pair this with the study area map generator.
Make a locator map in Python
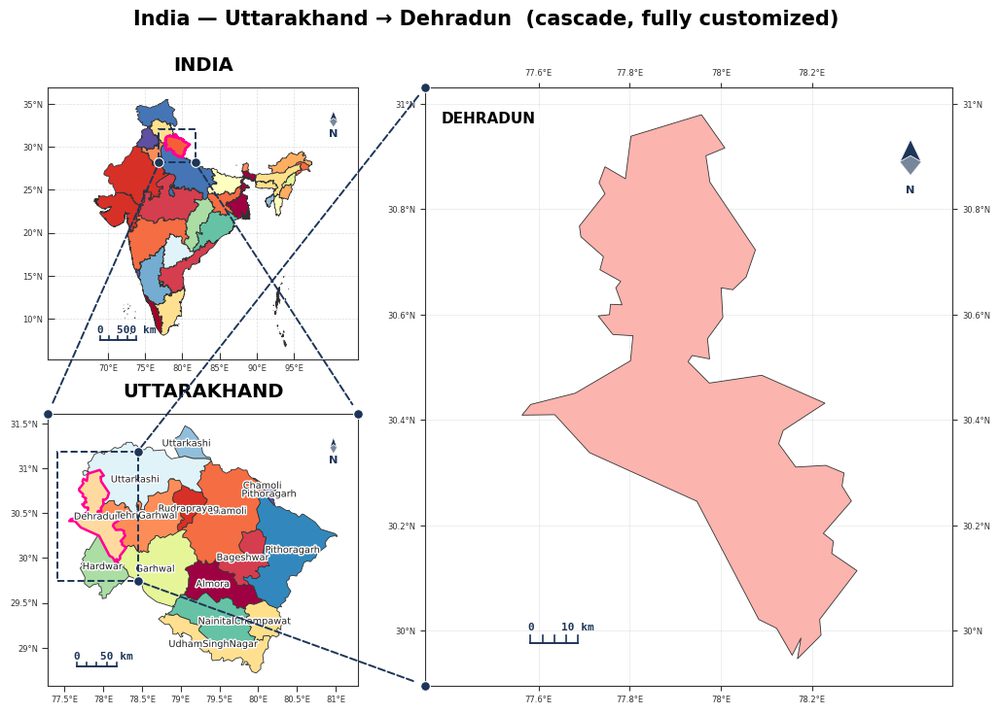
The fastest route is the cascade template: pass an ordered list of administrative steps from broad to specific, and AcadGIS draws each level as its own panel with connecting arrows linking parent to child.
Each step is a (level, name) pair. The generator loads the boundaries, highlights the correct child inside each parent, and arranges the panels left-to-right with a shared, publication-ready style. Supported levels are country, state, district, division and upazila, depending on the country's data.
import acadgis as agis
fig = agis.study_area(
    "India",
    steps=[("state", "Uttarakhand"), ("district", "Dehradun")],
    template="cascade",
    labels=True,
)
agis.save("locator.png", dpi=300)
The fluent builder for more control
If you prefer to read the geography as a sentence, the StudyArea builder does the same job with a fluent, chainable call. Set the context level for the widest panel, zoom into the region, then render the figure — the connecting arrows and highlight boxes are added for you.
This form is handy when you want to reuse one context object across several sites, or when a co-author needs to follow the logic of the nesting at a glance.
import acadgis as agis
fig = (agis.StudyArea("USA", context_level="state")
          .zoom_into("California", detail_level="district")
          .figure(suptitle="Study site: Los Angeles County"))
agis.save("la_locator.png", dpi=300)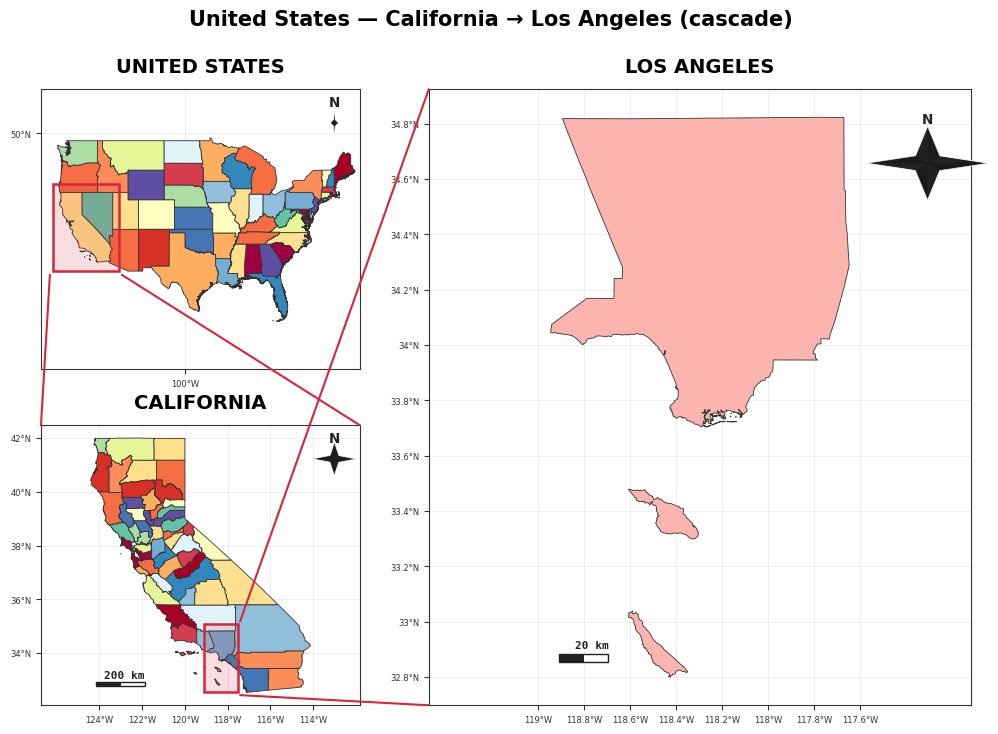
Examples and variations
The same locator generator adapts to different scales and story-telling needs:
- Country-in-the-world: when the audience is international, start with a world panel that highlights just the country — the same idea powers the world map country highlighter.
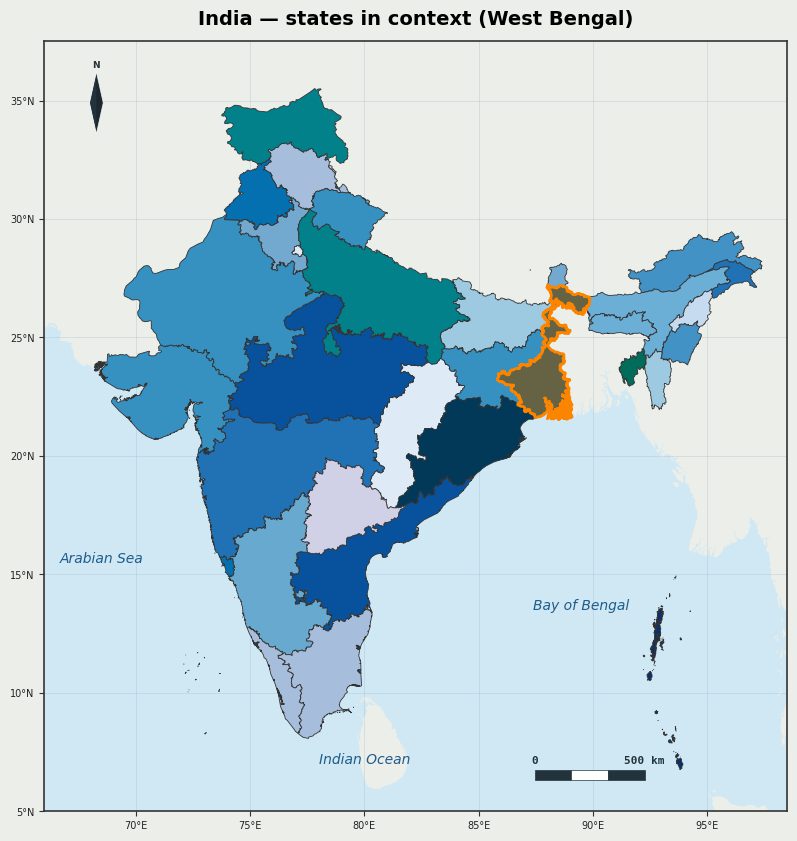
- Region-in-context: highlight one state among its neighbours to show relative position, as with West Bengal inside India.
- Site cascade: the full country to region to district chain shown above, ideal for a thesis frontispiece or a paper's Figure 1.
Because every panel is a real map object, you can layer terrain, rivers or points onto the detail panel before saving — useful when the locator doubles as the site overview in a thesis map.
Data sources and tips
Administrative boundaries come from GADM (country, state, district and finer levels) and Natural Earth (world and coastline context). Bangladesh, Iraq, India and the USA ship bundled with AcadGIS, so those locator maps build fully offline; every other country downloads by name on first use and is then cached.
A few tips for clean locator figures:
- Keep the cascade to three or four panels — country, region, site is usually enough, and more panels shrink each one below legibility.
- Turn
labels=Trueonly on panels where names fit; on the smallest inset a single highlight box reads more clearly than crowded text. - Export to PDF or SVG for vector-crisp insets in a typeset paper, or PNG at 300+ DPI for slides and posters.
- Let AcadGIS pick a sensible projection per panel rather than forcing one global projection onto a small district.
How to make a locator map with AcadGIS
- Install AcadGIS. Run pip install acadgis and start a Python session with import acadgis as agis.
- Choose your nesting levels. Decide the cascade from broad to specific, e.g. country to state to district, matching your study site's administrative hierarchy.
- Call the cascade generator. Use agis.study_area(country, steps=[("state", name), ("district", name)], template="cascade") to draw each level as a linked panel.
- Add context or detail. Set labels=True where names fit, or switch to the StudyArea builder with context_level and zoom_into for finer control.
- Export at publication quality. Call agis.save("locator.png", dpi=300) or save to PDF/SVG for vector-crisp insets in your paper or thesis.
Frequently asked questions
What is a locator map generator?
A locator map generator is a tool that automatically nests a study site inside its region and country as linked inset panels, orienting readers to where the work takes place. AcadGIS produces this cascade in Python with a single study_area call using template="cascade".
How do I make a locator map in AcadGIS?
Call agis.study_area(country, steps=[("state", name), ("district", name)], template="cascade") to draw each administrative level as its own panel with connecting arrows. Then use agis.save("locator.png", dpi=300) to export it.
What is the difference between a locator map and a study area map?
A locator map is the small inset cascade that shows where a site sits within its country and region, while a study area map is the detailed close-up of the site itself. AcadGIS builds both, and they are often combined into one figure.
Where does AcadGIS get its boundary data?
Administrative boundaries come from GADM and world context from Natural Earth. Bangladesh, Iraq, India and the USA are bundled for offline use, and other countries download by name on first request.
Can I add connecting arrows between the panels?
Yes. The cascade template automatically adds connecting arrows or highlight boxes linking each parent panel to the child it contains, so readers can trace country to region to site.
What file formats can I export a locator map to?
You can export to PNG, PDF or SVG at any DPI with agis.save(). Use PDF or SVG for vector-crisp insets in a typeset paper and PNG at 300+ DPI for slides and posters.
Which administrative levels does the cascade support?
AcadGIS supports country, state, district, division and upazila levels depending on the country's data. You order them broad-to-specific in the steps list, for example state then district.