 Acad
AcadStudy Area Map Generator for Theses and Papers
A study area map generator turns the "where did this research happen?" question into one clean, publication-ready figure. AcadGIS builds it in a few lines of Python: it nests your site inside its region and country, then adds a north arrow, scale bar and graticule automatically.
What a study area map generator does and why researchers need it
A study area map is the orientation figure almost every thesis, paper, grant and report opens with. It answers one question before the reader touches your data: where is this? A good one works at three scales at once — the country for global context, the administrative region for the reader who knows the country, and the zoomed-in study site itself, usually connected by leader lines so the eye can follow the drill-down.
Building this by hand in QGIS or ArcGIS means wrangling projections, aligning three map frames, and placing a north arrow, scale bar and graticule on each panel. A study area map generator collapses that into a single, reproducible command. Because the figure is code, you regenerate it instantly when a reviewer asks for a different region or a higher resolution — no reopening a desktop GIS project the week before your defence.
Make a study area map in Python
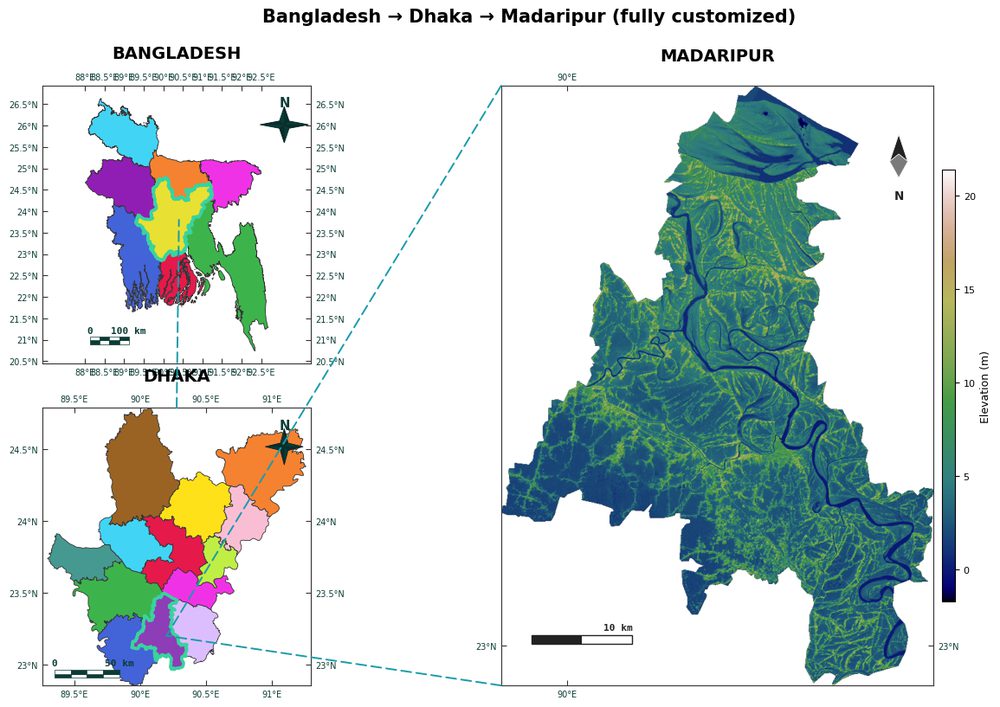
The fastest path is the study_area() preset. You give it a country and a list of drill-down steps, and it lays out a multi-panel cascade figure with the focus region highlighted, connectors drawn, and a north arrow, scale bar and graticule added to every panel. Turn on labels so place names appear on the panels that have room for them.
import acadgis as agis
fig = agis.study_area(
    "Bangladesh",
    steps=[("division", "Dhaka"), ("district", "Madaripur")],
    template="cascade", labels=True)
agis.save("study_area.png", dpi=300)
Fine-tune the layout with the StudyArea builder
The template argument switches the layout between single, two, cascade, series and grid, so you can match a full-page thesis figure or a single journal column. When you prefer a fluent, step-by-step builder over one call, the StudyArea class reads well: you set the country and context level, zoom_into() a region at a chosen detail level, and call figure() with a suptitle. It is the natural choice when you want a locator inset that drills one level deeper. For a dedicated inset-only figure, see the locator map generator.
import acadgis as agis
sa = agis.StudyArea("Iraq", context_level="state").zoom_into("Babil", detail_level="district")
fig = sa.figure(suptitle="Study area: Babil Governorate, Iraq")
agis.save("iraq_study_area.png", dpi=300)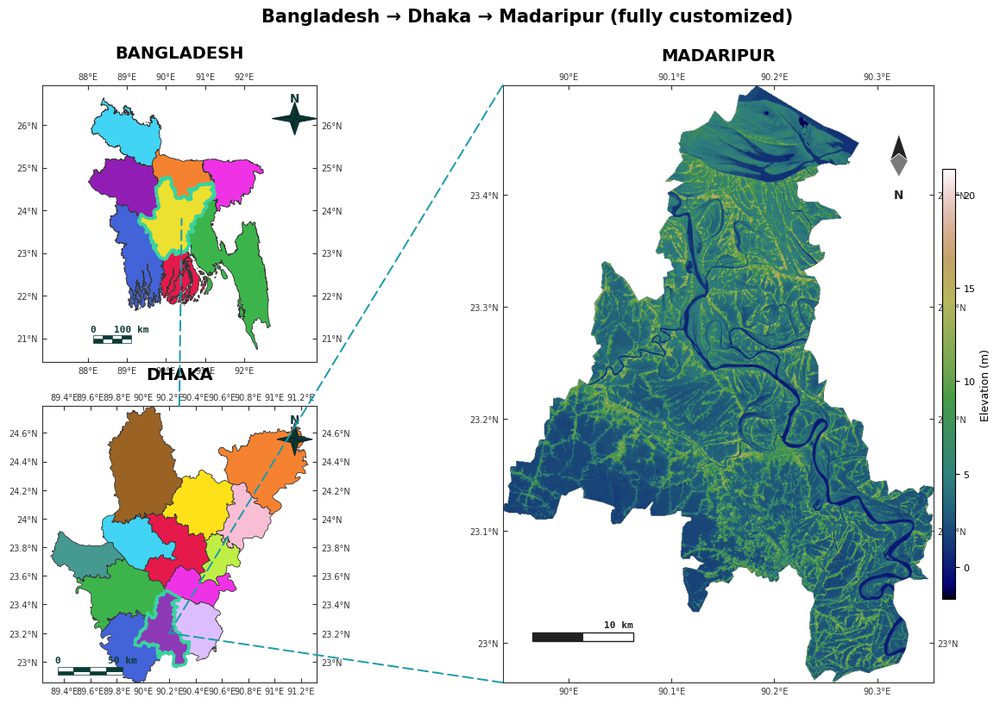
Add terrain, rivers and labels to the focus panel
Physical context often matters as much as administrative boundaries. Set terrain=True to shade the panels with Copernicus GLO-30 relief, turn on rivers=True to draw the drainage network from Natural Earth or OpenStreetMap, and pass a per-panel list to labels so region names appear only where there is room. Passing a list such as labels=[False, False, True] keeps the country and state overviews clean while naming features only on the zoomed-in site.
import acadgis as agis
fig = agis.study_area(
    "India", steps=[("state", "Uttarakhand"), ("district", "Nainital")],
    template="cascade", terrain=True, rivers=True,
    labels=[False, False, True])
agis.save("uttarakhand.png", dpi=300)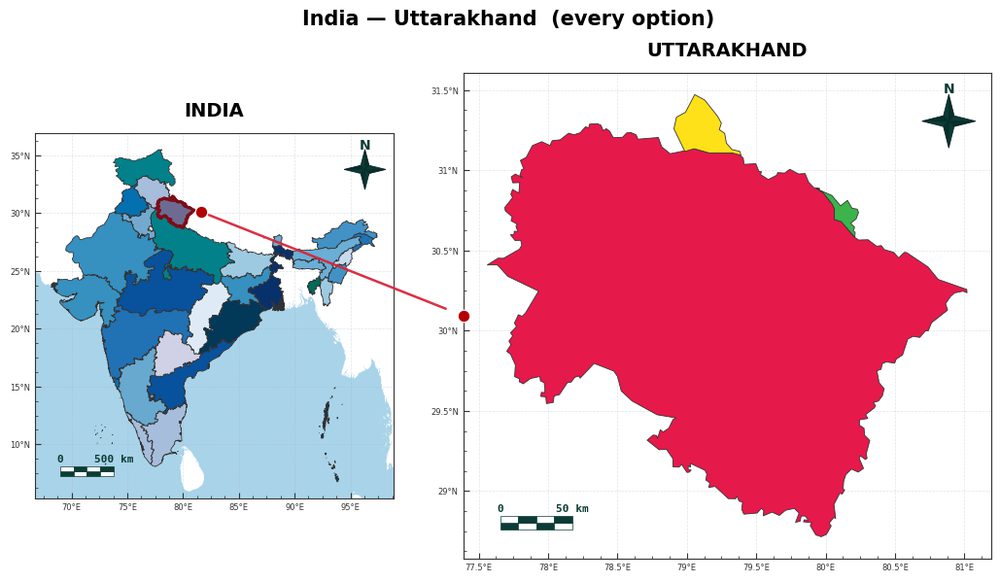
Data sources and offline coverage
Administrative boundaries come from GADM (national, division/state and district levels) and country outlines from Natural Earth. Terrain relief uses the Copernicus GLO-30 DEM, and rivers come from Natural Earth or OpenStreetMap. Bangladesh, India, Iraq and the USA ship bundled so their study-area maps render fully offline; any other country downloads by name on first use and is then cached.
Because boundaries load through the same administrative boundary system, you can drop your own measurements onto the focus region — a choropleth(), sampling points() or an add_heatmap() layer — and keep the locator context in the same figure. Names are fuzzy-matched, so your data table joins to the boundaries without manual key cleaning.
Common use cases
The study area map generator covers the recurring figures researchers actually submit:
- Thesis and dissertation orientation maps — the first figure of a methods chapter. The thesis map maker workflow builds on the same primitives.
- Journal paper location figures — a compact
two-panel country-plus-region layout that fits a single column. - Field campaign and sampling maps — the study-area frame with your sites overlaid as points.
- Grant and report context maps — a
cascadeorgriddrill-down that reviewers can read at a glance.
How to make a study area map with AcadGIS
- Install and import. Run pip install acadgis, then start every script with import acadgis as agis. Bangladesh, India, Iraq and the USA work offline; other countries download by name.
- Choose country and drill-down steps. Call agis.study_area(country, steps=[...]) with your administrative path, e.g. steps=[("division", "Dhaka"), ("district", "Madaripur")]. Each step adds a panel and highlights the focus region.
- Pick a layout template. Set template to single, two, cascade, series or grid to control how the panels and connector lines are arranged for your page format.
- Add layers. North arrow, scale bar and graticule are on by default. Add terrain=True, rivers=True, or a per-panel labels list for physical and place-name context.
- Export at print resolution. Call agis.save("study_area.png", dpi=300) to write a journal-ready figure, or agis.show() to preview it interactively.
Frequently asked questions
What is a study area map generator?
A study area map generator is a tool that produces the orientation figure showing where research took place, nesting the study site inside its administrative region and country. AcadGIS builds this in Python with a single study_area() call that adds a north arrow, scale bar and graticule automatically.
How do I make a study area map in Python with AcadGIS?
Call agis.study_area(country, steps=[("division","Dhaka"),("district","Madaripur")]) and then agis.save('study_area.png', dpi=300). The function lays out a multi-panel cascade figure with the focus region highlighted and connectors between panels.
Does the study area map include a north arrow, scale bar and graticule?
Yes, north arrow, scale bar and graticule are enabled by default on every panel. You can also choose the panel layout with the template argument, from single up to a five-way cascade or grid.
Which countries work offline?
Bangladesh, India, Iraq and the USA ship bundled with AcadGIS and render study-area maps fully offline. Any other country downloads its boundaries by name on first use and is cached for reuse.
Where do the boundaries and terrain data come from?
Administrative boundaries come from GADM and country outlines from Natural Earth. Terrain relief uses the Copernicus GLO-30 DEM, and rivers come from Natural Earth or OpenStreetMap.
Can I add my own data to the study area map?
Yes, you can overlay a choropleth, sampling points or a heatmap on the focus region while keeping the locator context in the same figure. Boundaries load through the same system as the AcadGIS choropleth() and points() functions, so data names fuzzy-match to the map automatically.
What layout templates are available?
AcadGIS offers single, two, cascade, series and grid templates. Cascade is the classic country-to-region-to-site drill-down, two fits a single journal column, and grid shows a multi-panel progression.