 Acad
AcadTerrain map generator: shaded relief from a DEM in Python
This Terrain map generator turns a Copernicus GLO-30 elevation model into a publication-ready shaded-relief map in a few lines of Python — no API key, no QGIS. AcadGIS blends hillshade with a hypsometric colour ramp and realistic ocean tinting so your study area looks like it belongs in a journal.
What a terrain map generator does and why researchers need it
A terrain map generator converts raw elevation data — a digital elevation model, or DEM — into a readable picture of the landscape. Instead of a flat grid of numbers, you get shaded relief: simulated light and shadow that make ridges, valleys and coastlines stand out the way they would in an aerial photo. Layered on top is a hypsometric tint, where colour encodes height, so a reader can tell a floodplain from a plateau at a glance.
Researchers need this because topography is context. A hydrology paper has to show catchment relief; an ecology study needs elevation gradients behind its sampling sites; a geomorphology thesis treats the terrain itself as the subject. A clean relief map communicates all of that instantly. AcadGIS produces one from a place name or bounding box, so you spend your time on the science, not on wrangling raster tiles. It pairs naturally with a study area map generator when you need both location and landform on the same figure.
Make a terrain map in Python
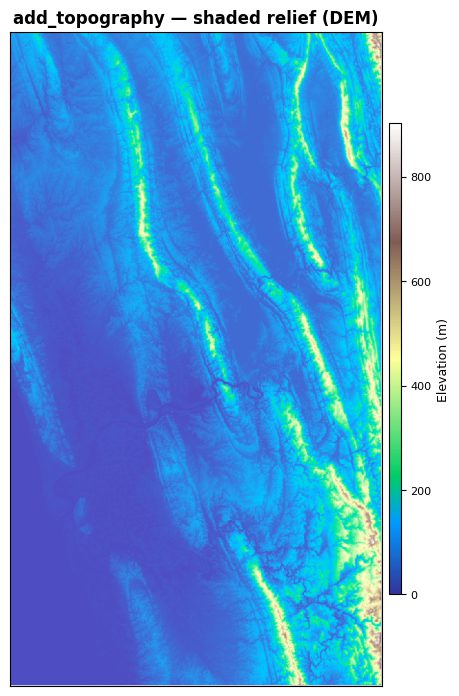
The shortest path is to load a DEM for your area and call relief(). AcadGIS fetches Copernicus GLO-30 tiles behind the scenes, computes the hillshade, applies a terrain colour ramp and tints the ocean a distinct blue — no API key and nothing to install beyond the package.
Point load_dem() at any region name; it downloads the tiles it needs and caches them so the second run is instant. Set ocean_color to keep water from blending into low-lying land, and drop hillshade=False in if you want a flat colour-by-elevation map with no shadows.
import acadgis as agis
dem = agis.load_dem("Nepal")
ax = agis.relief(dem, cmap="terrain", hillshade=True, ocean_color="#a9c9df")
agis.save("nepal_terrain.png", dpi=300)
Layer relief under boundaries and rivers
Terrain rarely stands alone. Use add_topography() to drop shaded relief onto an existing axis, then layer administrative boundaries or a stream network on top. This is how you build the composite figure most papers actually want: landform as the backdrop, your features in front.
Because every AcadGIS layer shares the same academic theme and projection handling, relief sits cleanly beneath a river network map generator layer or your own sampling points, without alignment headaches.
import acadgis as agis
gdf = agis.load_boundaries("Nepal", level="district")
ax = agis.plot(gdf, theme="academic", title="Study region relief")
agis.add_topography(ax, area="Nepal", cmap="terrain", ocean_color="#a9c9df")
agis.add_rivers(ax, area="Nepal", by_order=True)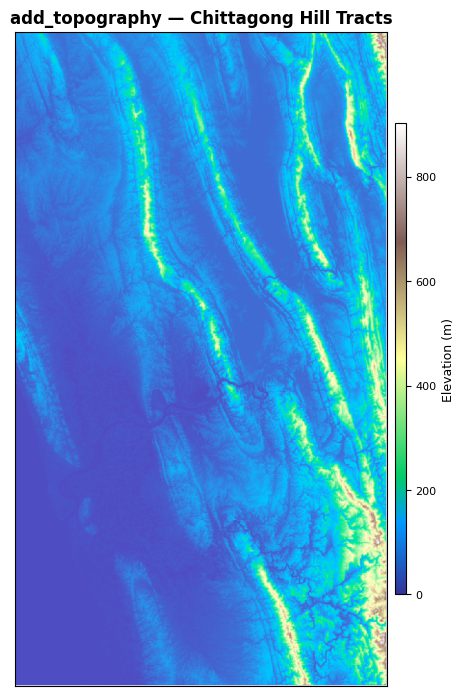
Realistic land-to-ocean colouring
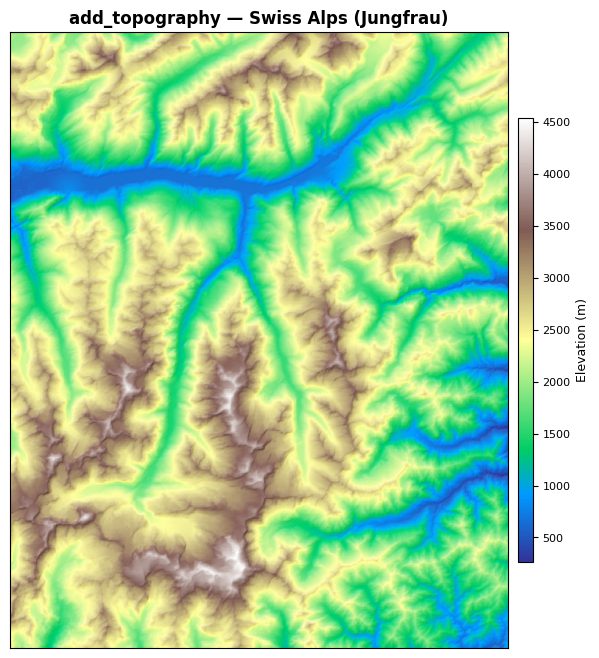
The difference between an amateur relief map and a convincing one is usually the colour logic, and AcadGIS handles two things for you. First, hypsometric tinting maps elevation to a natural ramp — deep greens for lowlands, tans and browns for mid-elevations, grey and white for high peaks — so height is legible without reading the legend. Second, a separate ocean colour replaces the ambiguous near-zero elevations of the sea with a flat, honest blue, so coastlines stay crisp and readers never mistake water for a low plain.
You control both: pass any Matplotlib colormap to cmap (the built-in "terrain" ramp is a sensible default) and set ocean_color to match your figure palette. This is what lets a high-relief scene like the Alps hold together — deep shadow in the valleys, white on the summits — instead of turning into visual mush.
Data sources and tips
AcadGIS builds terrain from Copernicus GLO-30, ESA's global 30 m DEM — open, well-validated and consistent worldwide, which is why it needs no API key. Administrative boundaries come from GADM, rivers and coastlines from Natural Earth, and roads from OpenStreetMap, so a full figure draws on established, citable datasets.
A few tips for clean output:
- Cite your DEM. Credit Copernicus GLO-30 in your figure caption or methods — reviewers expect a named elevation source.
- Match extent to your data. Load the DEM for the same region as your boundaries so relief and features align without cropping.
- Export high-DPI raster or vector. Use
agis.save("fig.png", dpi=300)for print-quality raster, or a PDF/SVG path for vector output. - Keep it subtle. If relief competes with your data layer, soften it by turning off hillshade or choosing a muted
ocean_color.
Building a full methods figure? See how terrain fits into a complete GIS map for a research paper.
How to generate a terrain map from a DEM in Python
- Install AcadGIS. Run pip install acadgis. Everything works through a single import acadgis as agis — no GIS software or API keys required.
- Load the DEM. Call agis.load_dem("Nepal") (or any region name). AcadGIS downloads and caches the Copernicus GLO-30 elevation tiles for that area automatically.
- Render shaded relief. Call agis.relief(dem, cmap="terrain", hillshade=True, ocean_color="#a9c9df") to blend hillshade with a hypsometric colour ramp and tint the ocean.
- Layer your features. Use agis.add_topography(ax, area=...) under agis.plot() boundaries or agis.add_rivers() so relief sits behind your study data on one figure.
- Export for publication. Call agis.save("terrain.png", dpi=300), or save to a PDF/SVG path, for a journal-ready, print-quality terrain figure.
Frequently asked questions
What is a terrain map generator?
A terrain map generator turns a digital elevation model (DEM) into a shaded-relief map, using simulated lighting and a colour ramp to show topography. AcadGIS generates one from a place name in a few lines of Python.
Do I need an API key to make a terrain map with AcadGIS?
No. AcadGIS uses the open Copernicus GLO-30 DEM and downloads the tiles automatically, so no API key, account or manual download is required. Results are cached, so repeat runs are instant.
What DEM does AcadGIS use for terrain maps?
AcadGIS uses Copernicus GLO-30, ESA's free 30 m global digital elevation model. It is consistent worldwide and open-licensed, which is why the terrain map generator works from cached tiles without any account.
What is hypsometric tinting?
Hypsometric tinting colours a map by elevation — typically greens for lowlands, browns for hills and white for peaks. AcadGIS applies it through the cmap argument in relief() and add_topography(), so height is readable without checking the legend.
How do I keep the ocean visually separate from low land?
Set the ocean_color argument in agis.relief() or agis.add_topography() to a distinct blue. This replaces near-zero sea elevations with a flat colour so coastlines stay crisp and water never looks like a low plain.
Can I put boundaries or rivers on top of the terrain?
Yes. Call agis.add_topography(ax, area=...) to draw relief on an axis, then layer agis.plot() boundaries, agis.add_rivers() or your own points on top. All AcadGIS layers share the same theme and projection, so they align automatically.
How do I export a terrain map for a paper?
Call agis.save("terrain.png", dpi=300) for a high-resolution raster, or save to a PDF or SVG path for vector output. Remember to cite Copernicus GLO-30 as your elevation source in the caption.