 Acad
AcadRiver Network Map Generator for Research Maps
AcadGIS is a river network map generator that overlays dense OpenStreetMap or Natural Earth hydrography onto your study area in a few lines of Python. It scales line width by stream order and can add DEM-derived streams, so the drainage reads clearly in a publication figure without manual tracing in a desktop GIS.
What is a river network map generator, and why researchers need one
A river network map generator takes a study region and draws its hydrography — main-stem rivers, tributaries, canals and derived streams — as line work you can style and label. The point is not decoration: catchment context explains where samples sit relative to flow, where pollutants travel, and how a watershed drains. Reviewers of hydrology, ecology and environmental papers expect that context, and hand-tracing it in a desktop GIS is slow and hard to reproduce.
AcadGIS treats rivers as a layer you add to a finished map. Scaling line width by stream order (Strahler-style ranking, where small headwaters are order 1 and the trunk river is highest) makes the drainage hierarchy legible at a glance — the Ganges reads heavier than a field ditch. Pair that with a clean study area map and you have a figure that stands on its own in a thesis or grant.
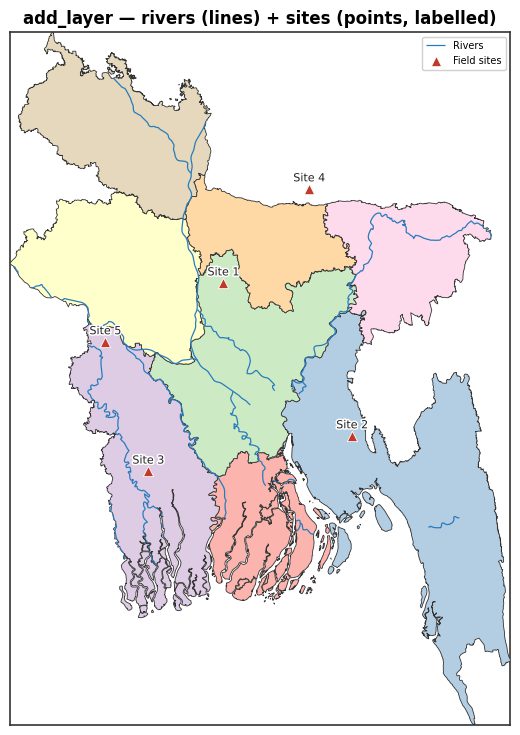
Make a river network map in Python
Load a boundary, plot it, then overlay the rivers. The by_order=True flag scales line width by stream order automatically, so trunk rivers stand out without any manual styling:
import acadgis as agis
bd = agis.load_boundaries("Bangladesh", level="district")
ax = agis.plot(bd, title="Bangladesh river network")
agis.add_rivers(ax, source="osm", by_order=True)
agis.add_cities(ax, bd)
agis.save("rivers.png", dpi=300)
Choosing a data source: Natural Earth, OpenStreetMap or a DEM
AcadGIS reads three kinds of hydrography, and the right one depends on scale:
- Natural Earth (
source="ne") — generalised, global, clean at country and continental scale. Best for context and locator figures. - OpenStreetMap (
source="osm") — dense waterways plus canals and irrigation channels, ideal for deltas, floodplains and small catchments where Natural Earth is too coarse. - DEM-derived streams — extracted from the Copernicus GLO-30 elevation model, giving a hydrologically consistent drainage network even where mapped rivers are sparse or ungauged.
These combine well: use OSM for the mapped canals near your sites, and DEM streams to fill in ungauged headwaters. For the elevation backdrop behind the streams, see the terrain map generator.
Composing rivers with terrain, cities and field sites
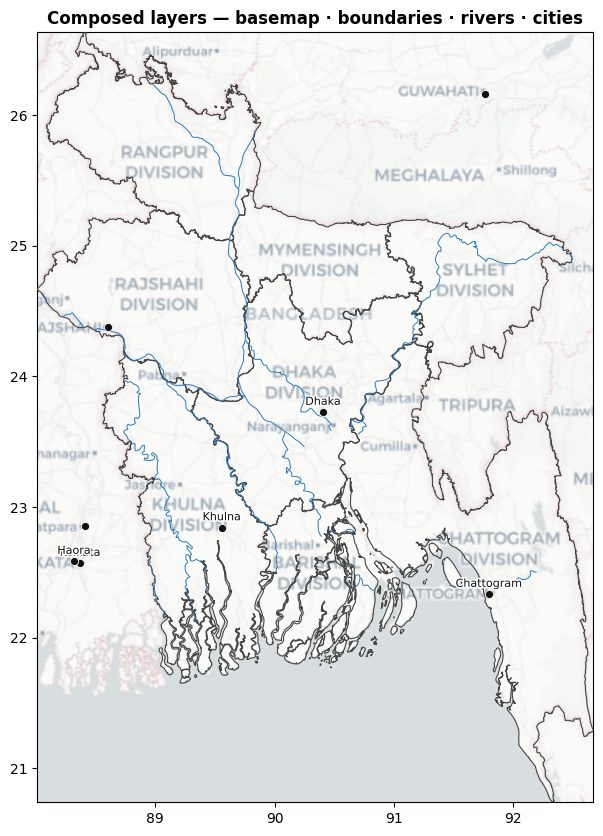
Because add_rivers draws onto an existing axis, you control the stacking order: basemap or terrain at the back, administrative boundaries next, then rivers, then cities and points on top. This lets one figure do the work of several — regional context, drainage and sample locations in a single panel.
A common ecology or water-quality layout puts DEM-shaded relief underneath, OSM rivers over it by stream order, and labelled monitoring stations on top. That pairs naturally with the sampling site map generator when you need to show exactly where measurements were taken along a channel.
Examples and use cases
Researchers reach for a river network map in situations like these:
- Hydrology and water quality — show a catchment's drainage with gauging or sampling stations along the channels.
- Ecology and fisheries — map species-survey reaches against tributary structure and stream order.
- Delta and floodplain studies — use dense OSM canals and distributaries where Natural Earth is too generalised.
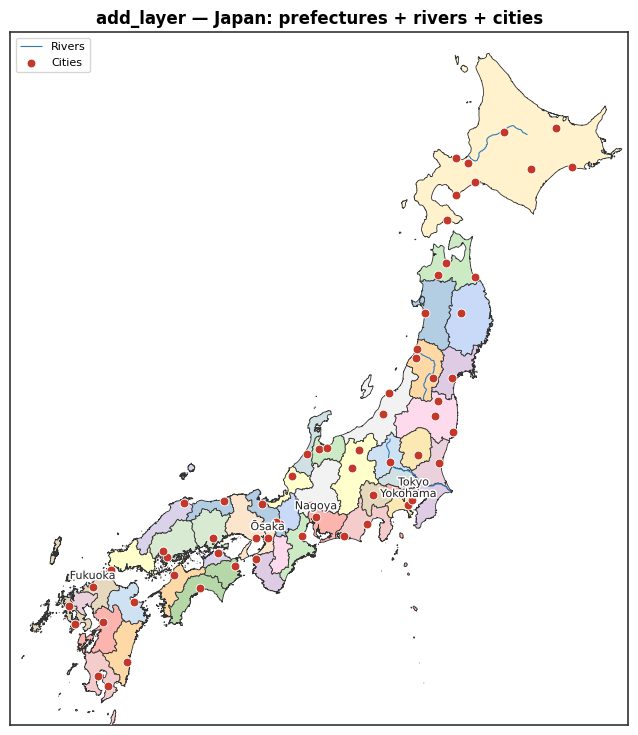
- Regional overviews — Japan prefectures with their major rivers and cities for a country-scale figure, as shown below.
Tips for clean, publication-ready river figures
A few practices keep river maps readable at print size:
- Keep
by_order=Trueso trunk rivers dominate and headwaters recede — flat-width networks look like noise at figure scale. - Prefer Natural Earth at country scale and OpenStreetMap when you zoom into a district or floodplain, so line density matches the extent.
- Render at
dpi=300withagis.save()for journal figures; the academic theme keeps type and line weights consistent. - Clip rivers to your region with
load_boundariesso channels don't trail off the map edge.
How to generate a river network map in Python with AcadGIS
- Install AcadGIS. Run pip install acadgis. No API key is needed, and Bangladesh, Iraq, India and the USA work fully offline.
- Load and plot your region. Call load_boundaries(country, level="district") for your study area and pass it to plot() to draw the base map.
- Overlay the rivers. Call add_rivers(ax, source="osm", by_order=True) to draw hydrography with line width scaled by stream order. Use source="ne" for generalised country-scale networks.
- Add context and export. Optionally add_cities(ax, area) and add_topography(ax) for a terrain backdrop, then save at print resolution with agis.save("rivers.png", dpi=300).
Frequently asked questions
What is a river network map generator?
A river network map generator draws a region's rivers, canals and streams as styled line work, typically scaling width by stream order so main-stem rivers read heavier than headwaters. AcadGIS generates one from a study area in a few lines of Python.
How do I add rivers to a map in AcadGIS?
Call add_rivers(ax, area, source="ne", by_order=True) after plotting your region. It overlays Natural Earth or OpenStreetMap hydrography onto the existing axis and scales line width by stream order automatically.
What data sources does AcadGIS use for rivers?
AcadGIS reads hydrography from Natural Earth for generalised global networks and OpenStreetMap for dense waterways and canals. It can also derive stream networks from the Copernicus GLO-30 DEM for ungauged or sparsely mapped areas.
Can I scale river width by stream order?
Yes, pass by_order=True to add_rivers and line width is scaled by stream order, so trunk rivers stand out and small tributaries recede. This makes the drainage hierarchy legible at figure scale.
Do I need an API key or an internet connection?
No API key is required. Bangladesh, Iraq, India and the USA ship bundled and work offline; other countries download their boundary and hydrography data by name the first time you use them.
Can I combine rivers with terrain and sampling sites?
Yes, because add_rivers draws onto an existing axis, you can stack terrain or a basemap underneath, rivers in the middle, and labelled cities or sampling points on top in a single figure.
Which river source should I use for a small catchment?
Use source="osm" for small catchments, deltas and floodplains, since OpenStreetMap includes dense canals and minor channels. Natural Earth (source="ne") is better for country- or continent-scale overviews.